RBI Sign In
Exciting Changes to rbiEXPERT!
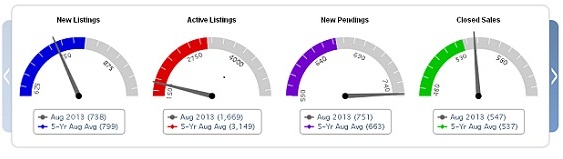
A new Stats Dashboard with gauges comparing the current Monthly Indicators against their 5-Year Average, Maximum and Minimum levels for that month to see trends. Tooltips, the boxes that show up when you mouse over the Interactive Charts, now include the Year-over-Year percentage change. New Design, the Statistics page streamlines your experience and has a new Explore tab for detailed stats. Click here for more information.